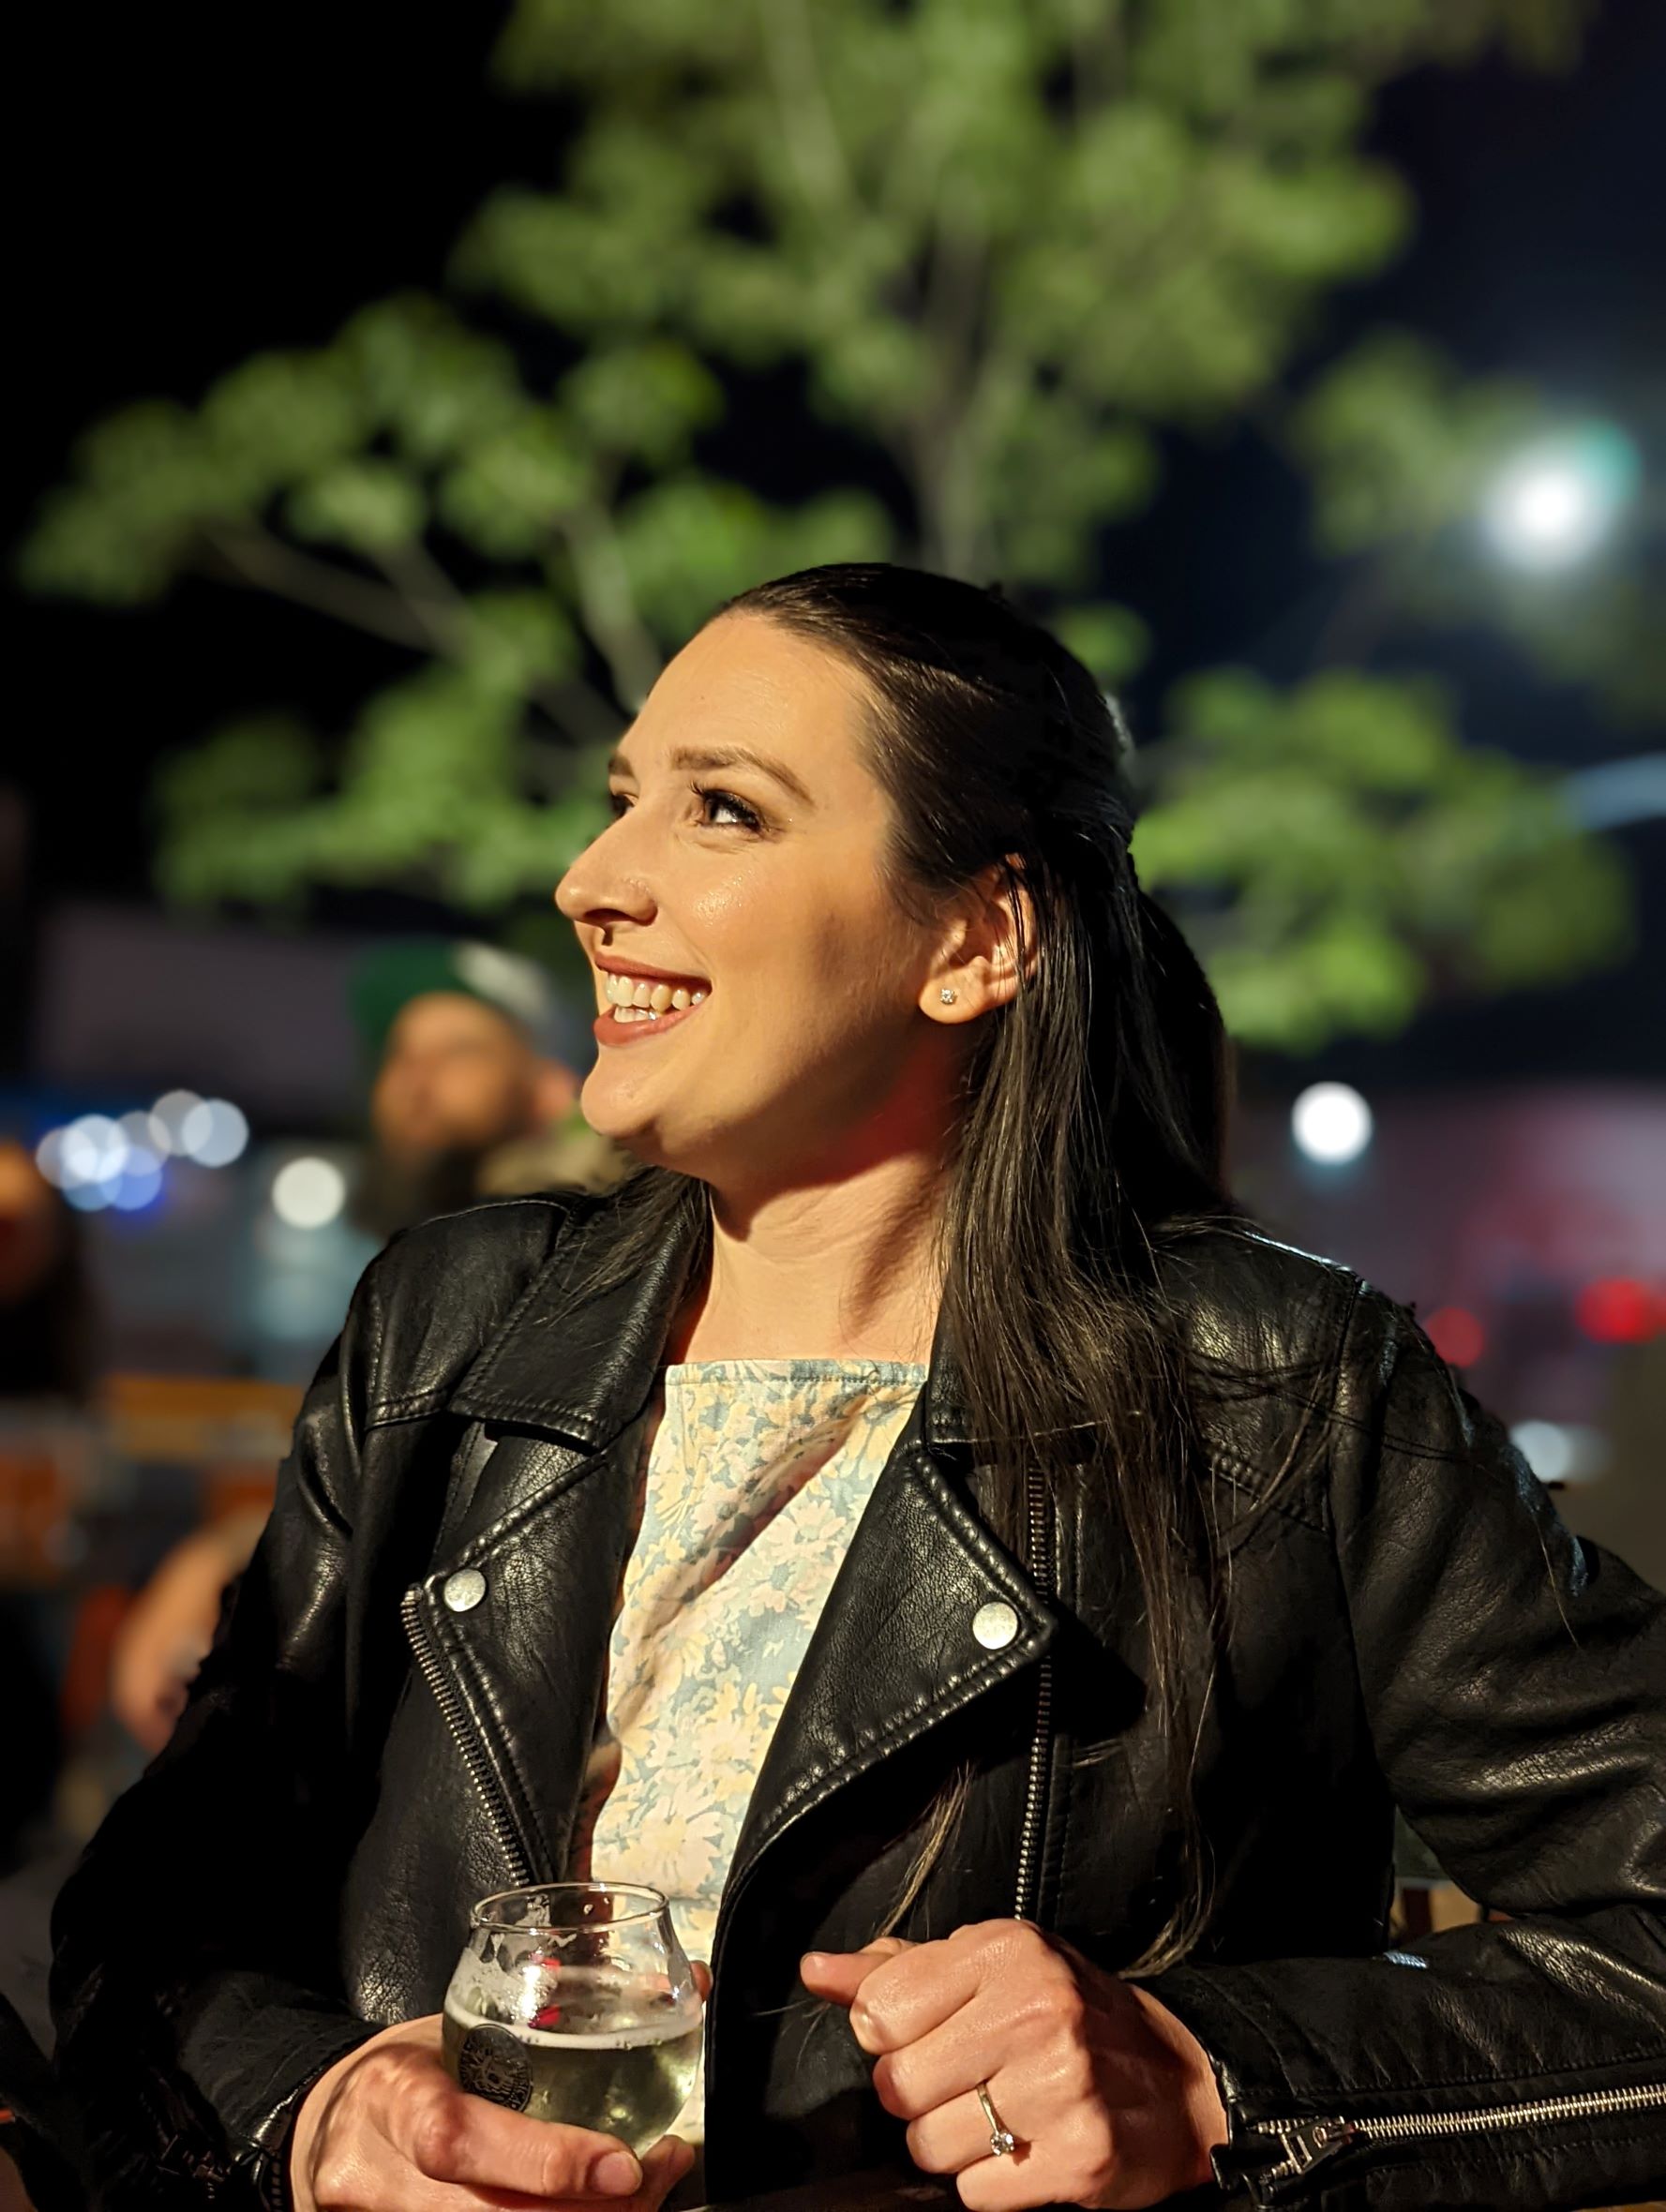
Result-driven data analyst with a background in the hospitality and service industries as well as skills in Excel, Word, VBA, Python, SQL, and Tableau with a certificate in the data analytics bootcamp with University of California San Diego. Creative critical thinker with attention to detail and organization who thrives in a team environment and takes the time to customize the experience to the customer. Enjoys skimming through data to track and find relevant trends to support making business-based decisions.With my ‘can do’ attitude, adaptability, and ability to trouble-shoot, I know that I can become a valuable asset to your team and take on any task at hand.
I am an aspiring data analyst from the UCSD Data analytics bootcamp, with a hunger to learn anything I can get my hands on. I have skills in Microsoft Office, Python, SQL, and much more. In my spare time, I enjoy getting out in nature to hike, cooking, and working with animals.
In my free time, I find joy in helping others. Recently, I've been involved with:
Data Analytics Certificate
The Data Science and Visualization Boot Camp at UC San Diego Extended Studies puts the student experience first, teaching students the knowledge and skills to conduct robust analytics.
Culinary Arts
Introduces you to the art and science of cooking and provides a solid foundation in savory cooking and baking.
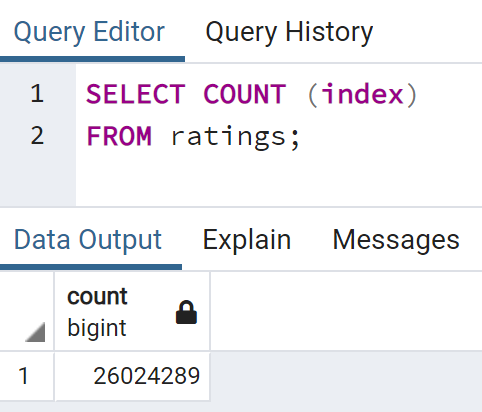
In this project, we can view data pulled from Wikipedia (1990-2018) with information about movies, including budgets and box office returns, cast and crew, production and distribution, and so much more. I extracted the data from the sidebar into a JSON then loaded it into a Pandas dataframe. I also obtained a dataset on Kaggle with movie ratings from MovieLens with over 20 million ratings. Once all the data was cleaned and usable, I was able to tidy up each movie entry into a standard format. I was then able to merge the Kaggle and the Wiki data using the IMDb ID column. I then did some further cleaning where the two sets of data overlapped with redundant data. Once everything was sorted and filtered, I moved the Pandas data frames over to an SQL database called movie-data. Doing this allows us to run more specific queries across all the information we have collected. Now we have created an automated pipeline that takes in new data, performs the appropriate transformations, and loads the data into existing tables.
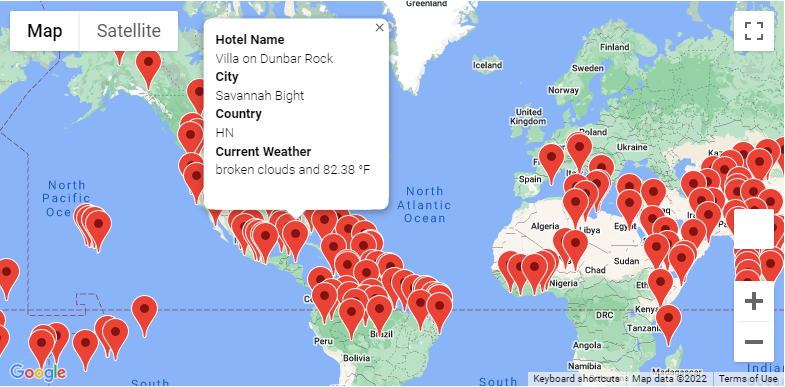
View on GitHubIn this analyis, we set up a user entered minimum and maximum perferred temp to search through a randomized list of cities. Using the Google Maps API, we were able to get the locations for these cities by Lat and Lng and monitor their real time weather. Based off what the user entered, we would find a hotel in their perferred cities and show them with markers on a map.
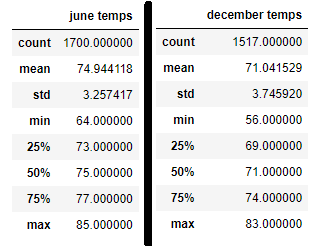
View on GitHubAfter a vacation in Hawaii, I have decided I want to live there and open a surf and shake shop! I have found W. Avy as a potential investor. His only concern is the weather having a negative effect on business. Take a look at some of the weather data from the island of Oahu to see how this could affect the business.
View on GitHubIn this analysis, we will be taking a look at some data from PyBer. Our goal is to help improve access to ride sharing services and determine affordability for underserved neighborhoods. To do this, we will be looking at weekly fares by city type.
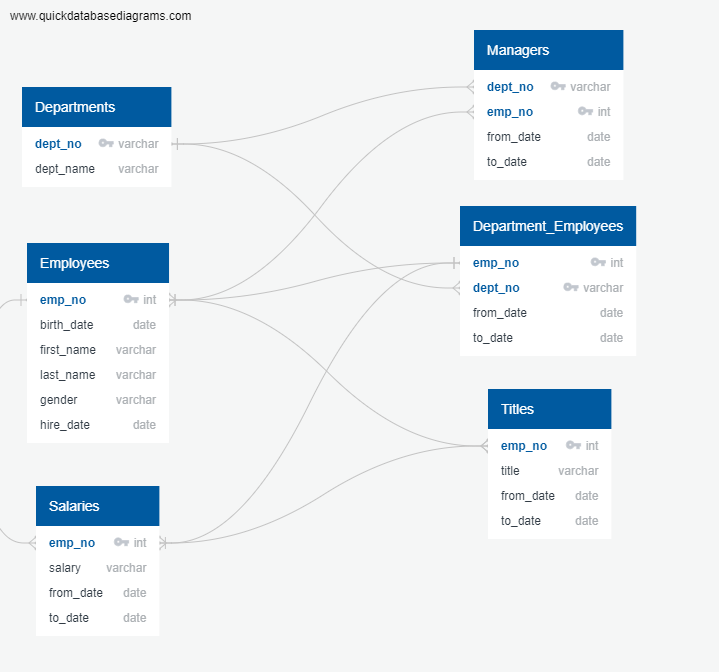
View on GitHubIn this project, I assisted Pewlett-Hackard in identifying all of the upcoming employees eligible for retirement as well as employees who could mentor greener employees to help fill their spots as they leave.
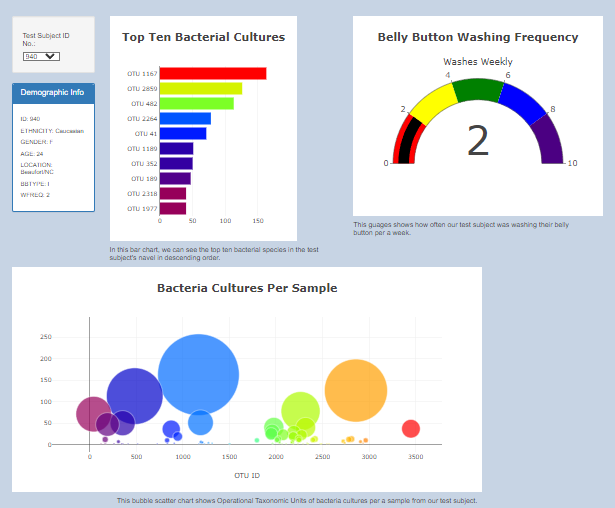
View on GitHubFor this project I was provided a json file full of information about each test subject and their test results. Using the powers of HTML, CSS, and JAVASCRIPT, I created an interactive dashboard to show each individuals results.
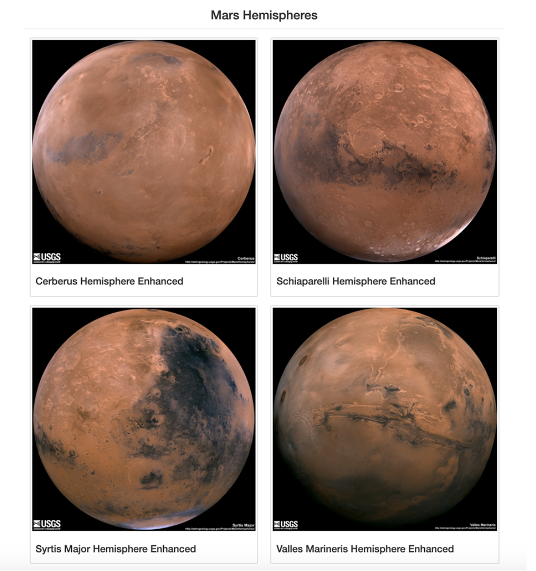
View on GitHubIn this project, we helped our friend Robin build a web app to scrape live data, from the NASA Mars News site, each type we run the script. We were able to achieve this by using HTML with BeautifulSoup and Splinter. In the end of the project, the goal was to scrape four full-resolution Mars hemisphere images and titles from the site to update the web app.
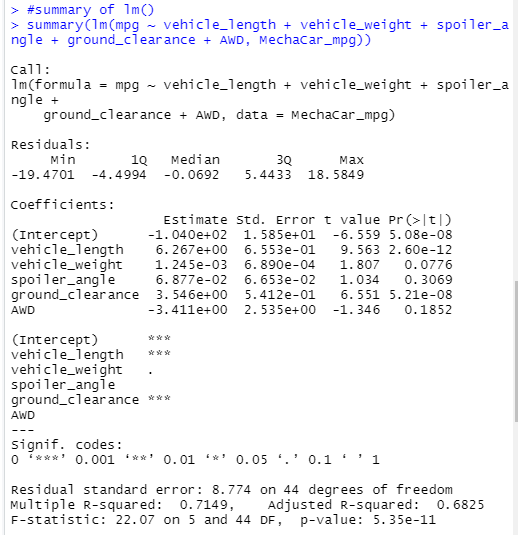
View on GitHubIn this project, I performed multiple linear regression analysis to identify which variables in the dataset predicted the mpg of MechaCar prototypes. I then collected summary statistics on the pounds per square inch (PSI) of the suspension coils from the manufacturing lots. Then I ran t-tests to determine if the manufacturing lots are statistically different from the mean population. This achvied a design for a statistical study to compare vehicle performance of the MechaCar vehicles against vehicles from other manufacturers.
View on GitHub